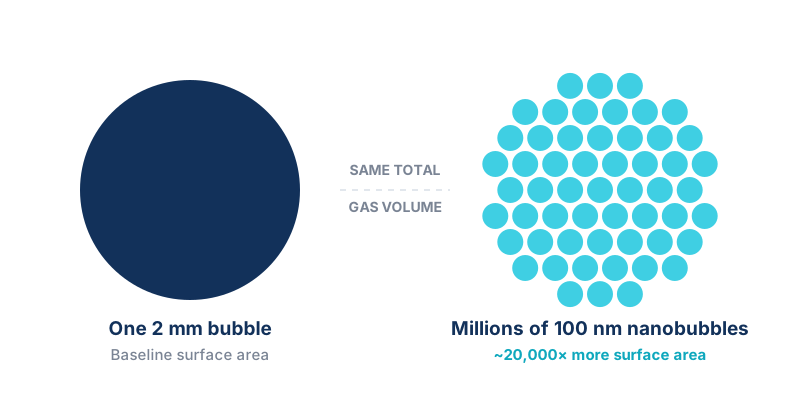
Nanobubbles are technically defined as gas bubbles under 1 micrometre (1,000 nm) in diameter. In practice, most commercial nanobubble systems concentrate their output well below that, typically under 200 nanometres — roughly 1/2500th the width of a human hair — since smaller bubbles deliver proportionally more surface area per litre of gas. Their advantage over conventional aeration is a matter of geometry, not simply falling under a size threshold. For a fixed volume of gas, splitting it into smaller bubbles multiplies the total surface area in contact with water — and gas transfer occurs at that interface. Surface area scales as A = 3V/r for a fixed gas volume V, so halving bubble radius doubles total water-contact area. One litre of gas held as 100 nm nanobubbles presents around 60,000 m² of surface — roughly 20,000 times more than the same litre split into typical fine-bubble-diffuser bubbles (2 mm), and around 40,000 times more than a standard aquarium airstone bubble (4 mm).
That surface-area advantage is reinforced by a much lower buoyant rise velocity at nanobubble scale, which keeps them dispersed longer than macro bubbles — though the long-term stability mechanism of bulk nanobubbles is still an active area of research, and Inpelor does not overstate what's settled science versus what's still being investigated. What's well established is the geometry: dramatically more water-contact surface per litre of gas is what drives sustained oxygen transfer, oxidative remediation, and biofilm disruption.
| Bubble type | Diameter | Surface area per litre of gas | vs. fine bubble | vs. airstone |
|---|---|---|---|---|
| Nanobubble | 70 nm | 85,714 m² | 28,571× | 57,143× |
| Nanobubble | 100 nm | 60,000 m² | 20,000× | 40,000× |
| Nanobubble | 150 nm | 40,000 m² | 13,333× | 26,667× |
| Nanobubble | 200 nm | 30,000 m² | 10,000× | 20,000× |
| Fine bubble diffuser | 2 mm | 3 m² | 1× | 2× |
| Aquarium airstone | 4 mm | 1.5 m² | 0.5× | 1× |
Total water-contact surface area for one litre of gas, assuming monodisperse spherical bubbles (A = 3V/r). Fine bubble and airstone diameters are representative industry figures — actual equipment varies.
Enter a bubble diameter and gas volume to calculate total water-contact surface area.
Assumes monodisperse spherical bubbles, A = 3V/r. For reference sizing only — real bubble populations vary in diameter.
For a fixed gas volume, smaller bubbles mean dramatically more water-contact surface — around 20,000× more than a fine-bubble diffuser at nanobubble scale. Since transfer happens at that interface, this is the primary driver of efficiency, not simply time spent in the water.
Organic matter, particulates, and microorganisms are frequently hydrophobic and preferentially accumulate at gas-water interfaces — the same phenomenon that underlies dissolved air flotation. Because that interface is also where a dissolved oxidant such as ozone reacts, contaminants concentrated there are exposed directly, rather than requiring the oxidant to diffuse through bulk water to find them. Nanobubbles' huge interfacial area per litre of gas means proportionally more of these accumulation sites, on top of the mass-transfer advantage above.
Evidence points to physical rather than oxidative disruption as the primary mechanism — bulk nanobubbles are short-lived, and the mechanics of how that brief existence translates into biofilm damage are explained below.
Bulk nanobubbles are short-lived. Under classical diffusive bubble dynamics (Epstein-Plesset theory), a 100 nm bubble's predicted dissolution time is on the order of microseconds to low milliseconds — the widely repeated claim that nanobubbles persist in water for days is, in fact, the anomaly still being investigated, not the settled baseline. Any explanation of biofilm disruption should be built on the sub-millisecond timescale that theory predicts, not the contested longer-duration claim.
Recent direct testing supports a physical rather than chemical explanation: hydroxyl radicals are measurably generated at the nanobubble interface, yet intracellular oxidative stress markers in exposed biofilms remain minimal — indicating physical disruption, not oxidation, is the dominant inactivation mechanism.
Inpelor's working hypothesis — not yet directly tested in the published literature — connects the pieces above: hydrophobic organic matter and particulates preferentially concentrate at the nanobubble's gas-water interface (the same interfacial partitioning behind the oxidative remediation effect described earlier). As the bubble rapidly dissolves, that concentrated material is left behind as a residual nanoparticulate. Entrained in the surrounding water flow, these particulates may impart an abrasive effect against biofilm structures — mechanical erosion rather than a direct blast from bubble collapse itself. We flag this explicitly as a hypothesis, consistent with which claims on this page are established versus still being worked out.
Dockar, D., Sullivan, P., Mifsud, J., Gibelli, L., & Borg, M. K. (2025). Ionic adsorption on bulk nanobubble interfaces and its uncertain role in diffusive stability. Journal of Colloid and Interface Science, 695, 137747.
Confirms there is no scientific consensus on why bulk nanobubbles reportedly persist longer than classical diffusive dynamics predict — the basis for building the biofilm mechanism on short bubble lifetime rather than extended persistence.
doi.org/10.1016/j.jcis.2025.137747Northage, N., Gomilšek, M., Modic, M., Vengust, D., Zorko, A., Cvelbar, U., & Walsh, J. L. (2026). Physicochemical and antimicrobial characterization of nanobubbles reveals physical disruption is the primary mode of biofilm inactivation. ACS ES&T Water, 6(6), 3852–3863.
Confirmed hydroxyl radical formation via ESR spin trapping, but found minimal intracellular oxidative stress in treated biofilms, concluding physical disruption — not oxidation — is the primary mode of nanobubble biofilm inactivation.
doi.org/10.1021/acsestwater.6c00252The studies below demonstrate ozone's antimicrobial effect delivered via micro- and nanobubbles. Most direct efficacy data — including the E. coli results — comes from microbubble-scale studies (1–100 µm); genuine nanobubble-scale studies exist for other pathogens. Since total interfacial surface area for a fixed gas volume scales inversely with bubble radius (see the calculator above), the same mechanism would be expected to produce a proportionally larger effect at nanobubble scale — though that specific extrapolation has not yet been directly tested in the peer-reviewed literature, to our knowledge.
Imaizumi, K., Tinwongger, S., Kondo, H., & Hirono, I. (2018). Disinfection of an EMS/AHPND strain of Vibrio parahaemolyticus using ozone nanobubbles. Journal of Fish Diseases, 41(4), 725–727.
Tested ozone nanobubbles against the shrimp pathogen strain responsible for acute hepatopancreatic necrosis disease — directly relevant to aquaculture applications.
doi.org/10.1111/jfd.12783Kawara, F., Inoue, J., Takenaka, M., et al. (2014). The influences of pepsin concentrations and pH levels on the disinfective activity of ozone nanobubble water against Helicobacter pylori. Digestion, 90(1), 10–17.
Found ozone nanobubble water retained bactericidal activity across a wide pH range (2.0–7.4), with no cytotoxicity observed on gastric epithelial cells.
doi.org/10.1159/000358286Yang, Z.-C., Peng, L., Jing, Z.-B., et al. (2025). Superior water disinfection via ozone micro-bubble aeration: Performance and mechanism. Journal of Hazardous Materials, 492, 138174.
Micro-bubble aeration cut ozone dose requirements by over 60% for 6-log inactivation of E. coli, with mechanistic evidence of membrane damage and DNA fragmentation.
doi.org/10.1016/j.jhazmat.2025.138174Tamaki, M., Kobayashi, F., Ikeura, H., & Sato, M. (2018). Disinfection by ozone microbubbles can cause morphological change of Fusarium sp. spores. The Plant Pathology Journal, 34(4), 335–340.
Electron microscopy showed faster spore membrane damage from microbubble ozone than larger ozone bubbles at the same dose — relevant to agricultural pathogen control.
doi.org/10.5423/PPJ.NT.11.2017.0234Nair, S. S., Pinedo-Cuenca, R., Stubbs, T., et al. (2022). Contemporary application of microbubble technology in water treatment. Water Science & Technology, 86(9), 2138–2156.
Review covering microbubble aeration, flotation, and ozonation mechanisms across wastewater treatment stages.
doi.org/10.2166/wst.2022.328Dissolved CO₂ forms carbonic acid in water (CO₂ + H₂O ⇌ H₂CO₃ ⇌ H⁺ + HCO₃⁻), lowering pH in a controlled, self-limiting way — as pH falls, the carbonate equilibrium shifts and the reaction naturally tapers off. That's a meaningfully different risk profile than dosing with concentrated mineral acids, where overshoot and handling hazards are real operational concerns.
The same surface-area physics established above for oxidation applies equally to CO₂ dissolution: gas transfer rate scales with interfacial area, so smaller bubbles dissolve CO₂ faster and more completely for the same gas volume. This isn't a separate mechanism to prove — it's the same A = 3V/r relationship applied to a different gas and a different objective. Applications span irrigation water alkalinity correction (agriculture), pH stability for stock health (aquaculture, where the safety profile of the reagent itself matters), and pH neutralization ahead of discharge (industrial and municipal wastewater).
A related but distinct application is concrete and cement-based materials, where CO₂ nanobubble water is used as mixing or curing water to drive carbonation reactions — converting calcium hydroxide to calcium carbonate, which improves compressive strength, reduces porosity, and can suppress carbonation shrinkage. CO₂ demand for this application is higher than for straightforward pH correction in near-neutral water: fresh cement mixing water starts highly alkaline (roughly pH 12–13, versus neutral tap water at pH 7), and that alkalinity buffers against pH change, so proportionally more CO₂ is required to reach a given target pH. Where the process goal is capturing and discharging water back at neutral pH — rather than driving it to strongly acidic — that higher buffering capacity is far less of a constraint.
Li, L., Wei, J., Lee, Y.-Y., et al. (2025). Comparative study of CO₂ nanobubbles and macrobubbles: Effects on water chemistry, microalgal growth, and carbon utilization. Water Research, 288(Pt B), 124714.
Measured a volumetric mass transfer coefficient roughly 1.2–1.9× higher for CO₂ nanobubbles than macrobubbles, with faster CO₂ saturation and higher carbon utilization efficiency — direct evidence the surface-area advantage extends to CO₂ dissolution, not just oxidative gases.
doi.org/10.1016/j.watres.2025.124714Han, Z., Kurokawa, H., & Matsui, H. (2022). Stability and free radical production for CO₂ and H₂ in air nanobubbles in ethanol aqueous solution. Nanomaterials, 12(2), 237.
Characterized how CO₂ nanobubble zeta potential and stability shift with pH, providing mechanistic grounding for how CO₂ nanobubbles behave as the solution they're dosing becomes more acidic.
doi.org/10.3390/nano12020237Choi, H.-J., Oh, T., Kim, G., Park, J.-J., Banthia, N., & Yoo, D.-Y. (2024). Development of Carbon Consuming Concrete (CCC) using CO₂ captured nanobubble water. Construction and Building Materials, 432, 136510.
CO₂-capturing nanobubble mixing water improved compressive strength, suppressed carbonation shrinkage, and increased C-S-H and CaCO₃ production compared to standard mixing water.
doi.org/10.1016/j.conbuildmat.2024.136510Kim, J., Kitagaki, R., & Choi, H. (2020). Pore filling effect of forced carbonation reactions using carbon dioxide nanobubbles. Materials, 13(19), 4343.
Repeated immersion of mortar specimens in CO₂ nanobubble water densified surface pores via CaCO₃ precipitation — a durability-focused restoration technique for existing concrete structures, with the effect scaling with the specimen's water/cement ratio.
doi.org/10.3390/ma13194343Nanobubble technology is well suited to specific water chemistry and contaminant profiles — it is not a universal fix. Inpelor's assessments are built to identify, before you commit capital, whether your site's conditions are a genuine match for the technology, or whether a different approach will serve you better. That independence is the entire basis of our consulting practice.
Bring us your water quality data and site conditions. We'll give you a clear, vendor-neutral view of what nanobubble technology can and can't do for your application.
